3 Find best model
We want to interpolate values from the depth measurement on to a raster grid. From this we can estimate the total volume of the peatland, and also visualize the depth profiles.
The main task in this chapter is the determination of optimal power for IDW by cross validation
3.1 Raster grid
Create raster grid based on the extent of the peatland
# Create empty raster grid (stars object) based
# on the extent of the peatland shape files.
# Resolution 1 = 1 m (becasue crs is UTM)
grid_Tydal_stars <- starsExtra::make_grid(SHP_tydal,
    1)
grid_Geilo_stars <- starsExtra::make_grid(SHP_geilo,
    1)
Visualise the grid
# To plot the grid we can convert the stars
# objects to sf. That way we can plot as polygons
# and visualise the individual cells.  This takes
# too long to perform for Geilo, but we can do it
# for Tydal:
grid_Tydal_sf <- st_as_sf(grid_Tydal_stars)

tm_shape(grid_Tydal_sf) + tm_polygons() + tm_shape(SHP_tydal) +
    tm_polygons(col = "yellow", alpha = 0.5)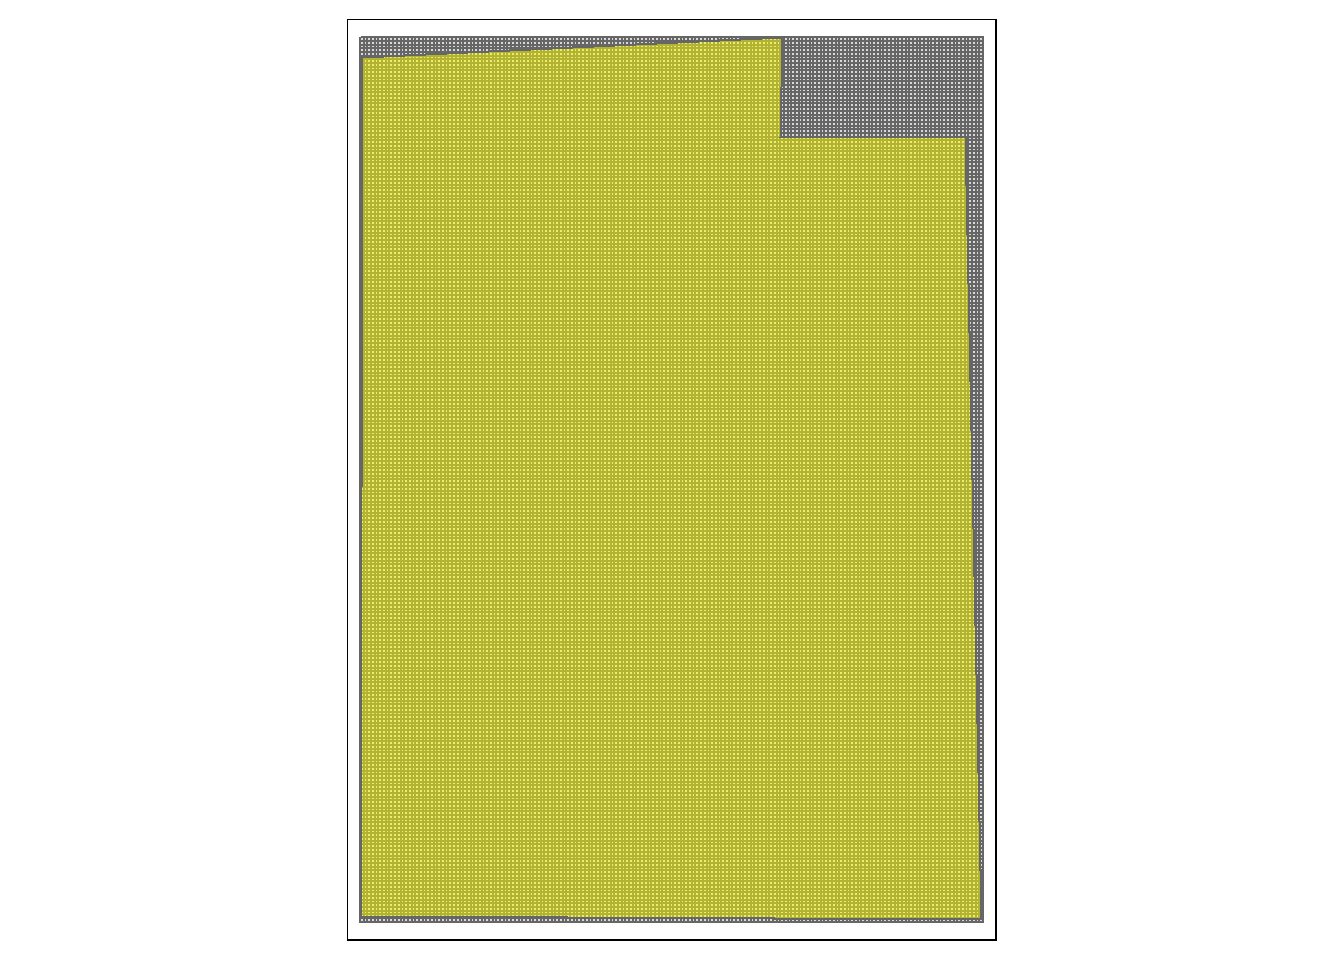
Figure 3.1: A 1x1 m raster grid in grey, overlayed with the peatland delineation in yellow.
Crop raster grid using the peatland delineation
grid_Tydal_stars_crop <- sf::st_crop(grid_Tydal_stars,
    SHP_tydal)
grid_Geilo_stars_crop <- sf::st_crop(grid_Geilo_stars,
    SHP_geilo)
tmap_arrange(tm_shape(grid_Geilo_stars_crop) + tm_raster(palette = "blue") +
    tm_layout(title = "Geilo", legend.show = F), tm_shape(grid_Tydal_stars_crop) +
    tm_raster(palette = "red") + tm_layout(title = "Tydal",
    legend.show = F))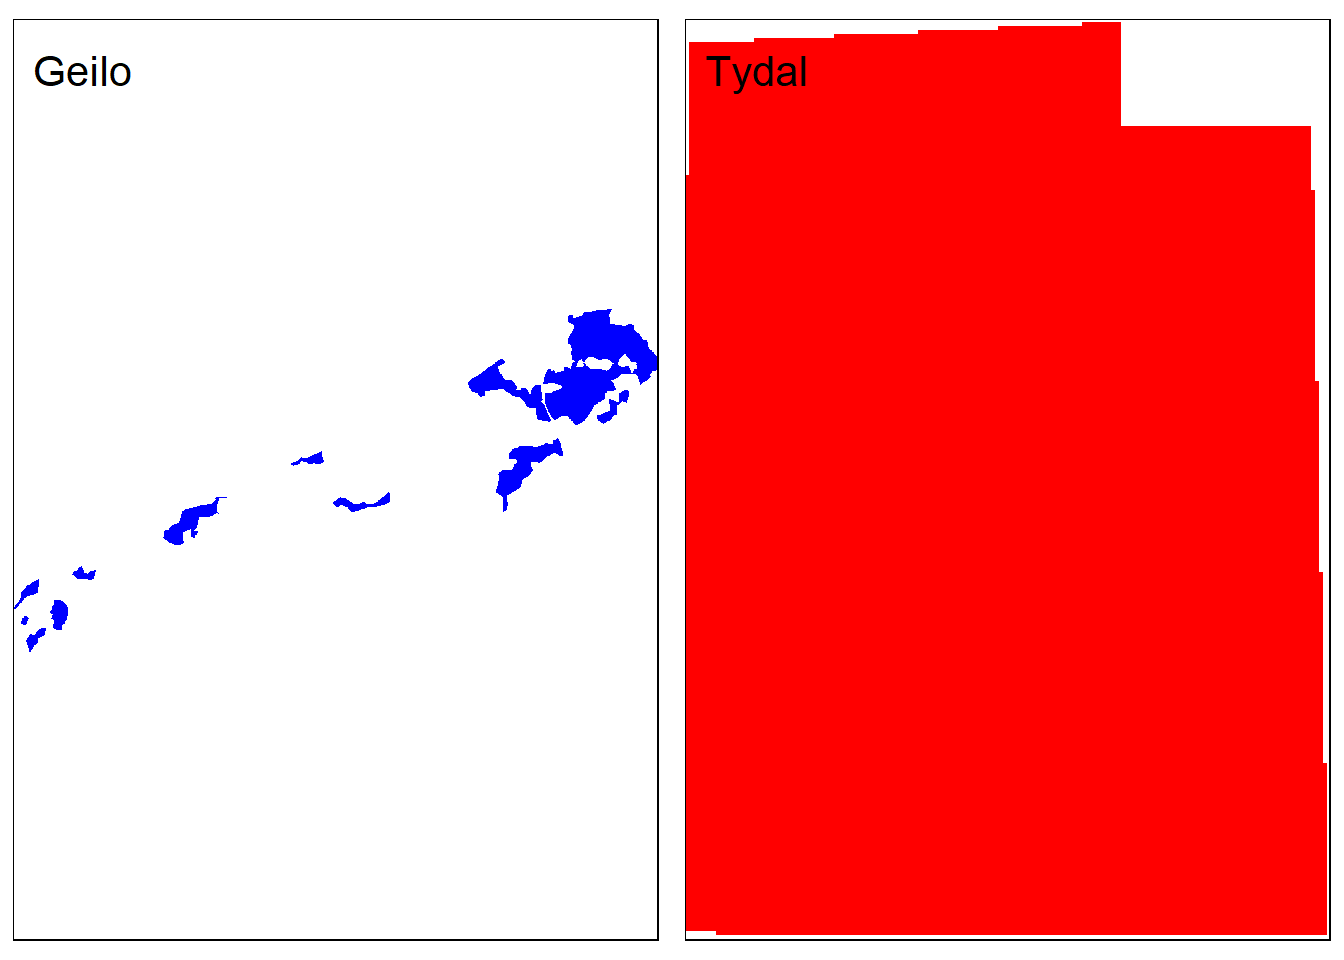
Figure 3.2: Preview of the cropped raster grids.
3.2 Inverse distance weighting
We chose to use Inverse distance weighting (IDW) for the interpolation instead of for example kriging. This is because we do not want to include a separate step with for example calculating a variogram, and the functions for automatically fitting a variogram seems unstable.
The IDW requires setting the number of neighboring points to consider. We could set this to consider all points in the dataset (the default), but this increases calculation times and it is also not sensible in general. I will start by considering the 9 nearest points, as this would mean all the 8 closest points in a systematic grid around a point is included.
nmax <- 9IDW also has a power parameter, and this is where we can tune the results by down-weighting data points that are further away. This parameter needs to be optimized for each model. We will fit a model with power varying from 0 to 10 and explore the model fit as a result of the chosen power.
First, lets explore the idw function and what the parameters mean. Tydal is 4.4 meters at it’s deepest point. Depending on the idw setting, the prediction map will be further of closer to this number. For example, is we only consider the closest neighbor, we are essentially performing a nearest neighbor interpolation (Fig. 3.3; left pane). The choice of power then has no effect, and the deepest point in the prediction map equals the deepest point in the measured data.
If we keep the power at zero (ignore distance weighting) and turn up nmax to 9, each raster cell is predicted to be the mean of the nine closest points (Fig. 3.3; middle pane). The overall predicted depth decreases.
If we then also include distance weighting, e.g. by setting power =2, we get smoothing between the points, and a more local prediction than when we had no power (i.e. the deepest point is again close to its true value) (Fig. 3.3; right pane).
temp <- gstat::idw(formula = Dybde ~ 1, locations = depths_tydal,
    newdata = grid_Tydal_stars_crop, idp = 0, nmax = 1)
#> [inverse distance weighted interpolation]

temp2 <- gstat::idw(formula = Dybde ~ 1, locations = depths_tydal,
    newdata = grid_Tydal_stars_crop, idp = 0, nmax = 9)
#> [inverse distance weighted interpolation]

temp3 <- gstat::idw(formula = Dybde ~ 1, locations = depths_tydal,
    newdata = grid_Tydal_stars_crop, idp = 2, nmax = 9)
#> [inverse distance weighted interpolation]


temp4 <- gstat::idw(formula = Dybde ~ 1, locations = depths_tydal,
    newdata = grid_Tydal_stars_crop, idp = 2, nmax = 20)
#> [inverse distance weighted interpolation]

temp4.1 <- gstat::idw(formula = Dybde ~ 1, locations = depths_tydal,
    newdata = grid_Tydal_stars_crop, idp = 2)
#> [inverse distance weighted interpolation]

temp5 <- gstat::idw(formula = Dybde ~ 1, locations = depths_tydal,
    newdata = grid_Tydal_stars_crop, idp = 100, nmax = 9)
#> [inverse distance weighted interpolation]

gg_temp <- tm_shape(temp) + tm_raster(col = "var1.pred",
    title = "", style = "fixed", breaks = seq(0, 5,
        1)) + tm_shape(depths_tydal) + tm_symbols(shape = 4,
    col = "black") + tm_layout(legend.outside = F,
    title = paste0("Power = 0\nNmax = 1"))

gg_temp2 <- tm_shape(temp2) + tm_raster(col = "var1.pred",
    title = "", style = "fixed", breaks = seq(0, 5,
        1)) + tm_shape(depths_tydal) + tm_symbols(shape = 4,
    col = "black") + tm_layout(legend.outside = F,
    title = paste0("Power = 0\nNmax = 9"))

gg_temp3 <- tm_shape(temp3) + tm_raster(col = "var1.pred",
    title = "", style = "fixed", breaks = seq(0, 5,
        1)) + tm_shape(depths_tydal) + tm_symbols(shape = 4,
    col = "black") + tm_layout(legend.outside = F,
    title = paste0("Power = 2\nNmax = 9"))

gg_temp4 <- tm_shape(temp4) + tm_raster(col = "var1.pred",
    title = "", style = "fixed", breaks = seq(0, 5,
        1)) + tm_shape(depths_tydal) + tm_symbols(shape = 4,
    col = "black") + tm_layout(legend.outside = F,
    title = paste0("Power = 2\nNmax = 20"))

gg_temp4.1 <- tm_shape(temp4.1) + tm_raster(col = "var1.pred",
    title = "", style = "fixed", breaks = seq(0, 5,
        1)) + tm_shape(depths_tydal) + tm_symbols(shape = 4,
    col = "black") + tm_layout(legend.outside = F,
    title = paste0("Power = 2\nNmax = Inf"))

gg_temp5 <- tm_shape(temp5) + tm_raster(col = "var1.pred",
    title = "", style = "fixed", breaks = seq(0, 5,
        1)) + tm_shape(depths_tydal) + tm_symbols(shape = 4,
    col = "black") + tm_layout(legend.outside = F,
    title = paste0("Power = 100\nNmax = 9"))
tmap_arrange(gg_temp, gg_temp2, gg_temp3, ncol = 3)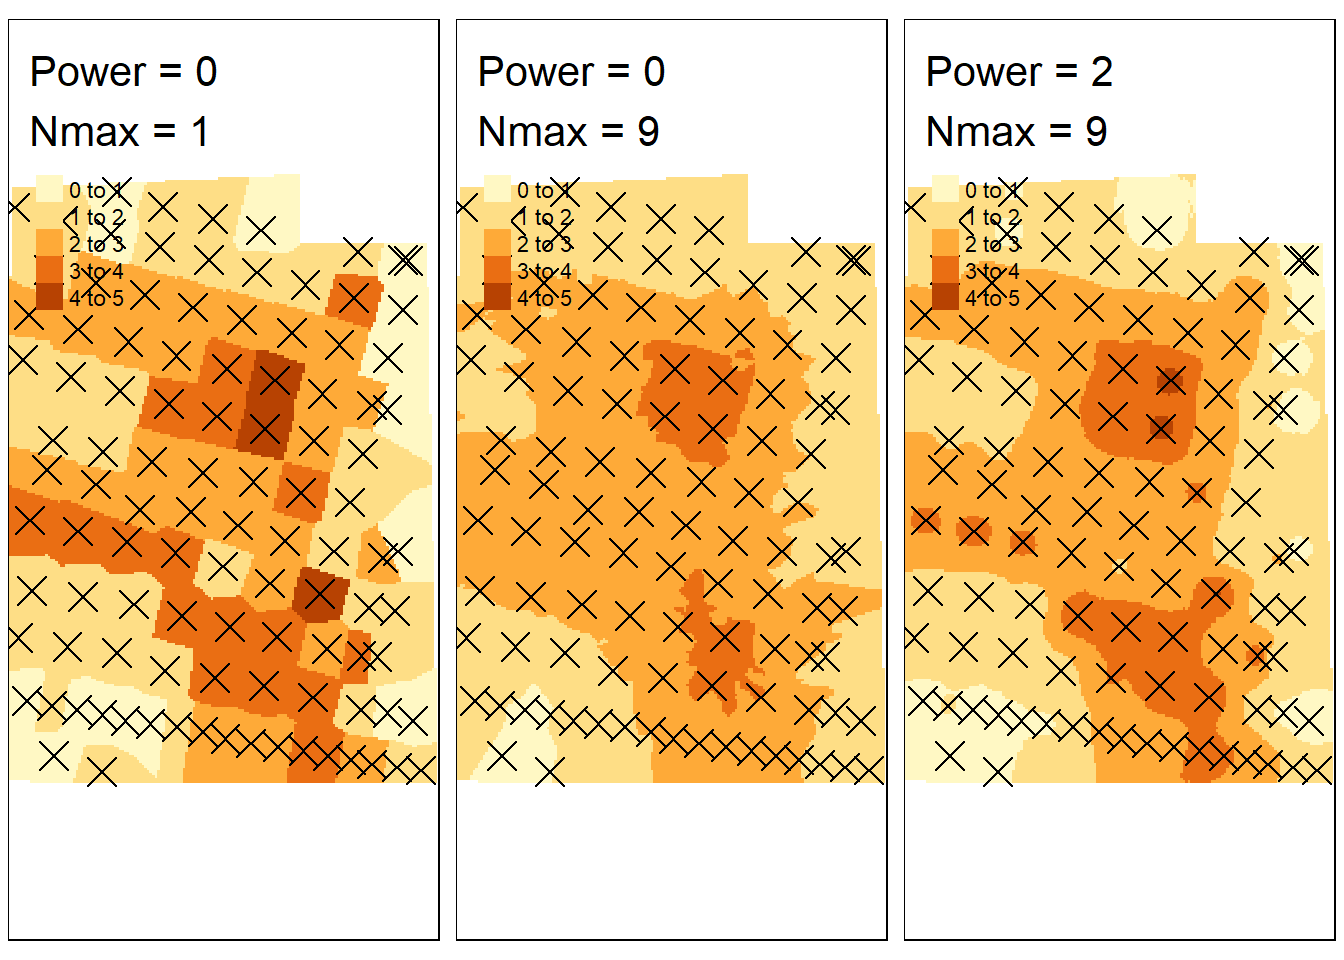
Figure 3.3: IDW with different setting.
tmap_arrange(gg_temp4, gg_temp4.1, gg_temp5, ncol = 3)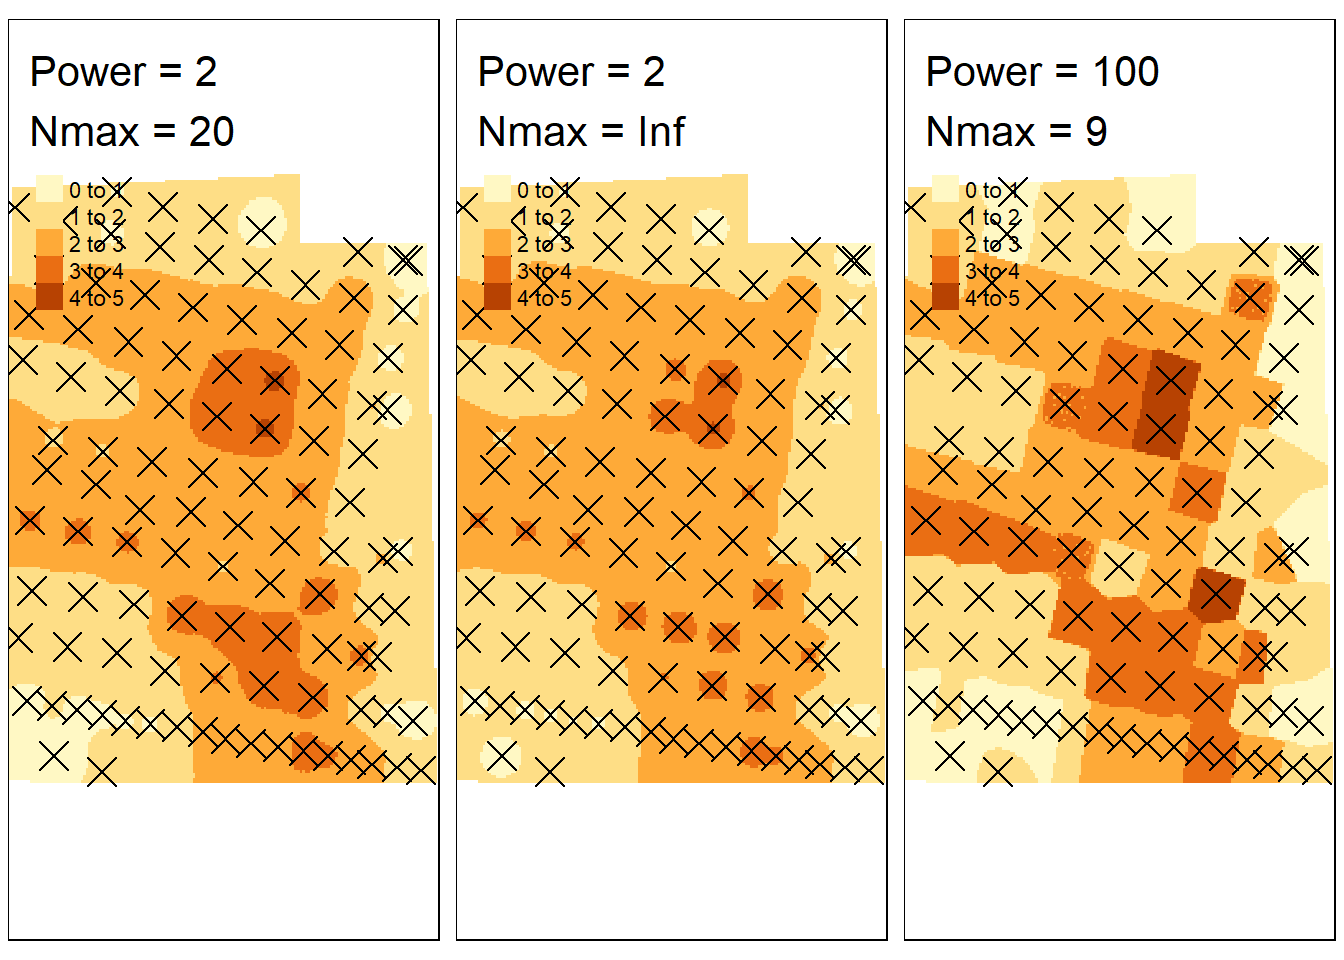
Figure 3.4: IDW with different setting.
If we increase nmax to 20, and retain the distance weighting, we get a slightly flatter (loss local) estimation than with nmax = 9 (Fig. 3.4; left pane).
If we ramp up the nmax to consider all the points in the dataset, this has little additional effect as long as we have a positive power parameter (Fig. 3.4; middle pane). For bigger data sets however, the computation time might become an issue.
If we keep nmax at 9, and ramp up the power, we approach what we had at the beginning, that is a nearest neighbor interpolation (Fig. 3.4; right pane).
Of all the examples above, power = 2 and nmax = 9 is probably the best. However, I don’t like these little dots on the map. They are artefacts of the model, and do not exist for real. Therefore I think I would prefer a model with a slightly more local focus. We can increase the power a bit to achieve this.
temp <- gstat::idw(formula = Dybde ~ 1, locations = depths_tydal,
    newdata = grid_Tydal_stars_crop, idp = 4, nmax = 9)
#> [inverse distance weighted interpolation]

tm_shape(temp) + tm_raster(col = "var1.pred", title = "",
    style = "fixed", breaks = seq(0, 5, 1)) + tm_shape(depths_tydal) +
    tm_symbols(shape = 4, col = "black") + tm_layout(legend.outside = T,
    title = paste0("Power = 4\nNmax = 9"))
Figure 3.5: IDW with relatively local focus.
After a bit of trial and error, I noticed that by having nmax as low as 9, the optimum power frequently became <2 (which results in model artefacts and biased predictions as you can read about below, esp Fig. 3.9). I therefore increase the nmax.
temp <- gstat::idw(formula = Dybde ~ 1, locations = depths_tydal,
    newdata = grid_Tydal_stars_crop, idp = 5, nmax = 20)
#> [inverse distance weighted interpolation]

tm_shape(temp) + tm_raster(col = "var1.pred", title = "",
    style = "fixed", breaks = seq(0, 5, 1)) + tm_shape(depths_tydal) +
    tm_symbols(shape = 4, col = "black") + tm_layout(legend.outside = T,
    title = paste0("Power = 4\nNmax = 20"))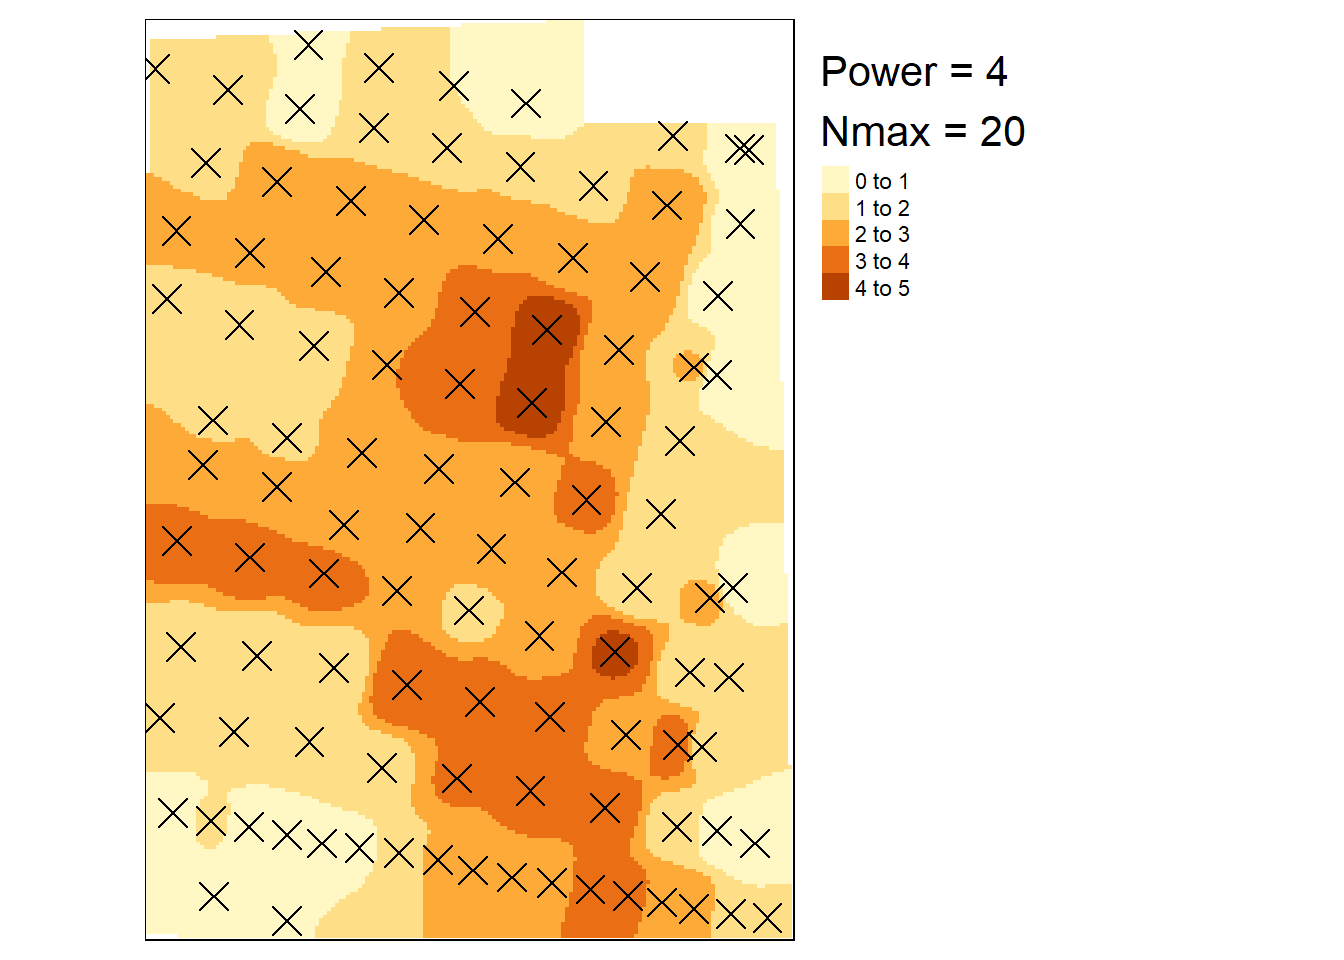
Figure 3.6: IDW with slightly higher nmax and higher power.
nmax <- 20This tuning of the power parameter is where we will focus now. Here I perform IDW for power between 0 and 10 to compare the results.
myPowers <- c(0:10)
for (i in myPowers) {
    temp <- gstat::idw(formula = Dybde ~ 1, locations = depths_tydal,
        newdata = grid_Tydal_stars_crop, idp = i, nmax = nmax)
    assign(paste0("IDW_tydal_", i), temp)
}

# this one takes a couple of minutes to run
for (i in myPowers) {
    temp <- gstat::idw(formula = Dybde ~ 1, locations = depths_geilo,
        newdata = grid_Geilo_stars_crop, idp = i)
    assign(paste0("IDW_geilo_", i), temp)
}
What do these models look like?
for (i in myPowers) {

    temp <- get(paste0("IDW_tydal_", i))

    temp <- tm_shape(temp) + tm_raster(col = "var1.pred",
        palette = "-viridis", title = "Interpolated peat\ndepth (m)") +
        tm_layout(legend.outside = T, title = paste0("Power = ",
            i)) + tm_shape(depths_tydal) + tm_symbols(col = "black",
        shape = 4, size = 0.5)
    assign(paste0("tmap_IDW_tydal_power_", i), temp)
}


tmap_arrange(tmap_IDW_tydal_power_0, tmap_IDW_tydal_power_1,
    tmap_IDW_tydal_power_2, tmap_IDW_tydal_power_4,
    tmap_IDW_tydal_power_6, tmap_IDW_tydal_power_8,
    ncol = 3)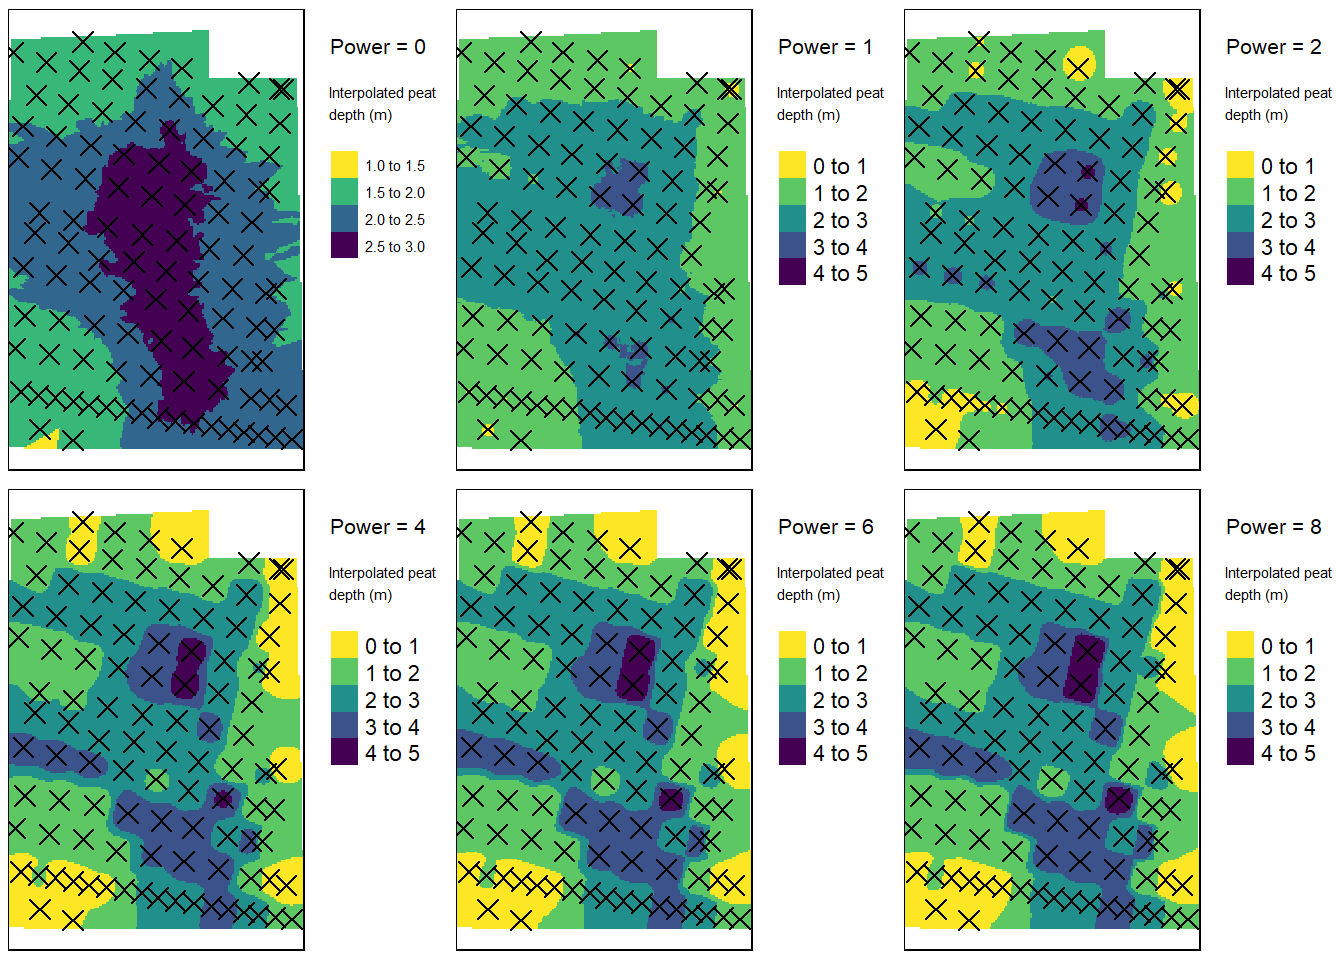
Figure 3.7: First view of how IDW models look like depending on the power parameter. Test site: Tydal.
When plotting Geilo I cannot include the crosses for the depth measurements because there are just too many and they clutter up the image.
for (i in myPowers) {

    temp <- get(paste0("IDW_geilo_", i))

    temp <- tm_shape(temp) + tm_raster(col = "var1.pred",
        palette = "-viridis", title = "Interpolated peat\ndepth (m)") +
        tm_layout(legend.outside = T, title = paste0("Power = ",
            i))
    assign(paste0("tmap_IDW_geilo_power_", i), temp)
}


tmap_arrange(tmap_IDW_geilo_power_1, tmap_IDW_geilo_power_2,
    tmap_IDW_geilo_power_4, ncol = 1)
Figure 3.8: First view of how IDW models look like depending on the power parameter. Test site: Geilo.
A low power creates a more flat map where all the depth measurements count equally to any predicted value. With power set to 0 we just predict the average of all the measured peat depths. For both cases, increasing the power beyond 4 has little visual effect.
3.3 Original residuals
Let’s check the fit with a plot of the residuals.
# Prepare data frame with the measured data
resids_tydal <- data.frame(ID = 1:nrow(depths_tydal))
resids_geilo <- data.frame(ID = 1:nrow(depths_geilo))

resids_tydal$measured <- depths_tydal$Dybde
resids_geilo$measured <- depths_geilo$Dybde

# Get the predicted values
for (i in myPowers) {
    temp <- get(paste0("IDW_tydal_", i))
    fit <- stars::st_extract(temp, depths_tydal)
    resids_tydal[, i + 3] <- resids_tydal$measured -
        fit$var1.pred
}

for (i in myPowers) {
    temp <- get(paste0("IDW_geilo_", i))
    fit <- stars::st_extract(temp, depths_geilo)
    resids_geilo[, i + 3] <- resids_geilo$measured -
        fit$var1.pred
}

# Lots of NA's produced for depth measurements
# taken outside the peatland polygons
# tmap_mode('plot') tm_shape(IDW_geilo_10)+
# tm_raster(col='var1.pred')+
# tm_shape(fit[is.na(fit$var1.pred),])+
# tm_symbols(size = .1, col='yellow')

resids_geilo <- resids_geilo[!is.na(resids_geilo$V3),
    ]


resids_tydal <- tidyr::pivot_longer(resids_tydal, !ID &
    !measured, names_to = "power", values_to = "residual")
resids_geilo <- tidyr::pivot_longer(resids_geilo, !ID &
    !measured, names_to = "power", values_to = "residual")


# Remove V from column names
resids_tydal$power <- gsub(pattern = "V", replacement = "",
    x = resids_tydal$power)
resids_geilo$power <- gsub(pattern = "V", replacement = "",
    x = resids_geilo$power)

resids_tydal$power <- as.numeric(resids_tydal$power)
resids_geilo$power <- as.numeric(resids_geilo$power)

resids_tydal$power <- resids_tydal$power - 3
resids_geilo$power <- resids_geilo$power - 3


gg_resids_tydal <- ggplot(resids_tydal, aes(x = factor(power),
    y = residual)) + geom_boxplot(fill = "grey", trim = F) +
    theme_bw(base_size = 12) + xlab("Power") + ggtitle("Tydal")
#> Warning in geom_boxplot(fill = "grey", trim = F): Ignoring
#> unknown parameters: `trim`


gg_resids_geilo <- ggplot(resids_geilo, aes(x = factor(power),
    y = residual)) + geom_boxplot(fill = "grey", trim = F) +
    theme_bw(base_size = 12) + xlab("Power") + ggtitle("Geilo")
#> Warning in geom_boxplot(fill = "grey", trim = F): Ignoring
#> unknown parameters: `trim`
ggpubr::ggarrange(gg_resids_geilo, gg_resids_tydal)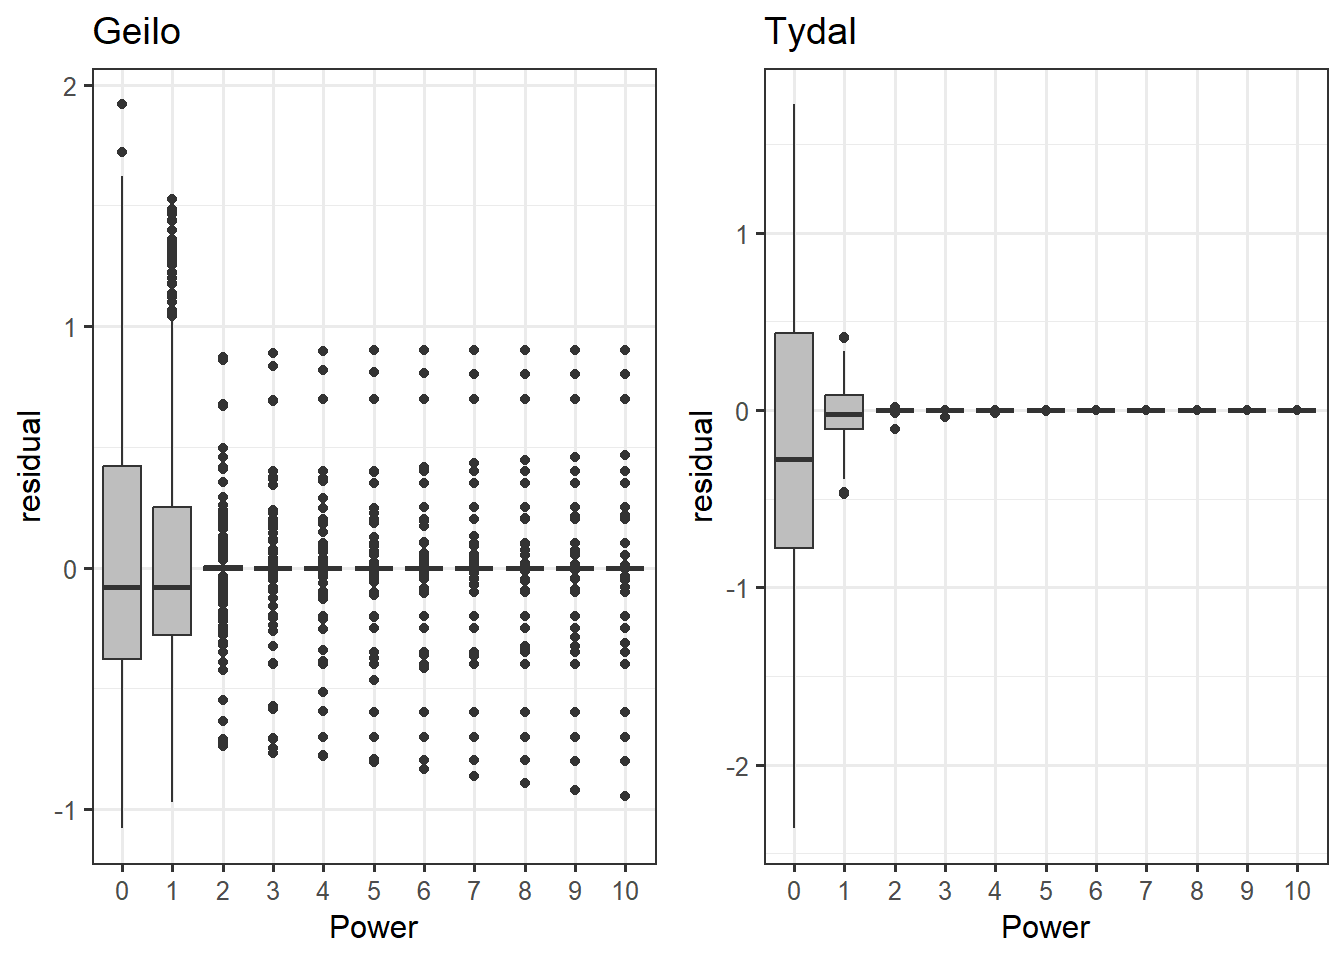
Figure 3.9: Residuals (observed - predicted) stabelize with power greater than 2.
With a power of 2 or greater, the residuals are very stable and unbiased (centered on 0).
3.4 Estimated volume
What about the estimated volume - does that change depending on the power setting? Note that because the data are projected in UTM, the mean depth (in meter) of each 1x1 raster cell equals the volume in m3.
volume_tydal <- NULL
for (i in myPowers) {
    temp <- get(paste0("IDW_tydal_", i))
    volume_tydal <- c(volume_tydal, sum(temp$var1.pred,
        na.rm = T))
}


volume_geilo <- NULL
for (i in myPowers) {
    temp <- get(paste0("IDW_geilo_", i))
    volume_geilo <- c(volume_geilo, sum(temp$var1.pred,
        na.rm = T))
}
volume_tydal <- data.frame(volume = volume_tydal, power = myPowers)
volume_tydal$relative_volume <- volume_tydal$volume/mean(volume_tydal$volume) *
    100

volume_geilo <- data.frame(volume = volume_geilo, power = myPowers)
volume_geilo$relative_volume <- volume_geilo$volume/mean(volume_geilo$volume) *
    100


gg_predVolume_tydal <- ggplot(volume_tydal, aes(x = factor(power),
    y = relative_volume)) + geom_point(size = 10) +
    xlab("power") + ylab("Peat volume as a percentage of\nmean predicted peat volume") +
    theme_bw(base_size = 12) + ggtitle("Tydal")

gg_predVolume_geilo <- ggplot(volume_geilo, aes(x = factor(power),
    y = relative_volume)) + geom_point(size = 10) +
    xlab("power") + ylab("Peat volume as a percentage of\nmean predicted peat volume") +
    theme_bw(base_size = 12) + ggtitle("Geilo")

ggpubr::ggarrange(gg_predVolume_geilo, gg_predVolume_tydal)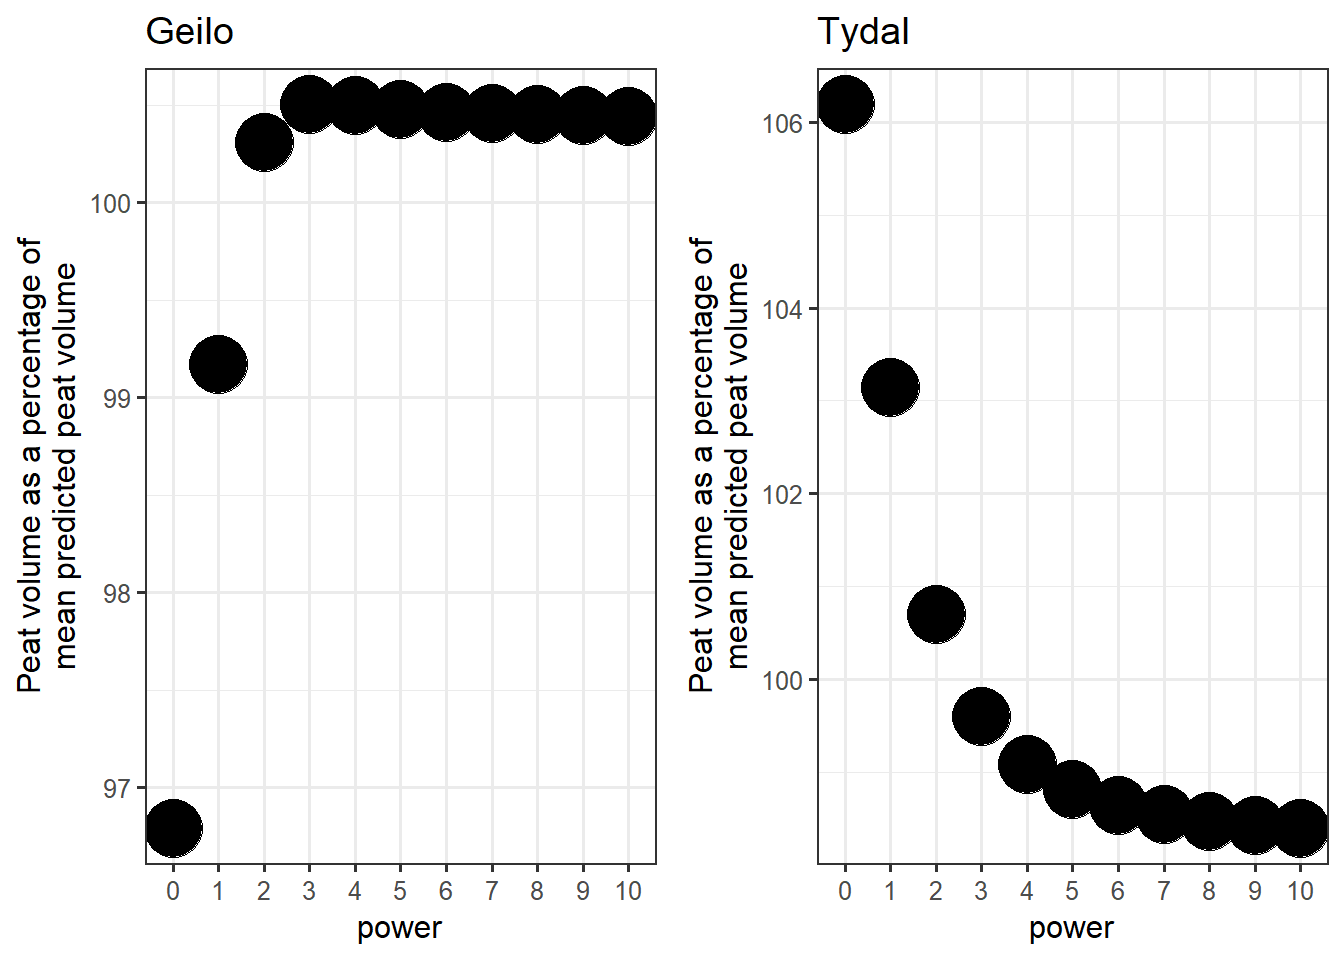
Figure 3.10: Peat volume estimates as a function of the power parameter.
The values are stabilizing relatively fast, but a power of less than 3 seems like a bad idea. In general though, the difference between the worst and best models is just 2-4%.
This relationship probably depends a bit on the number of data points and the density of peat depth measurements. So we should not generalise just yet.
3.5 Model fit LOOCV
Now let’s do a proper test of model fit, using leave one out cross validation. I will use the mean absolute deviation as my measure of model fit.
MAE_tydal <- data.frame(power = myPowers, MAE = as.numeric(NA))
for (i in myPowers) {
temp <- krige.cv(Dybde ~ 1, depths_tydal, set = list(idp = i),
nmax = nmax)
MAE_tydal$MAE[MAE_tydal$power == i] <- mean(abs(temp$residual))
}
#>
|
| | 0%
|
| | 1%
|
|= | 2%
|
|= | 3%
|
|== | 4%
|
|== | 5%
|
|=== | 6%
|
|=== | 7%
|
|==== | 8%
|
|==== | 9%
|
|===== | 10%
|
|===== | 11%
|
|====== | 12%
|
|====== | 13%
|
|======= | 14%
|
|======= | 15%
|
|======== | 16%
|
|======== | 17%
|
|========= | 17%
|
|========= | 18%
|
|========== | 19%
|
|========== | 20%
|
|=========== | 21%
|
|=========== | 22%
|
|============ | 23%
|
|============ | 24%
|
|============= | 25%
|
|============= | 26%
|
|============== | 27%
|
|============== | 28%
|
|=============== | 29%
|
|=============== | 30%
|
|================ | 31%
|
|================ | 32%
|
|================= | 33%
|
|================= | 34%
|
|================= | 35%
|
|================== | 36%
|
|================== | 37%
|
|=================== | 38%
|
|=================== | 39%
|
|==================== | 40%
|
|==================== | 41%
|
|===================== | 42%
|
|===================== | 43%
|
|====================== | 44%
|
|====================== | 45%
|
|======================= | 46%
|
|======================= | 47%
|
|======================== | 48%
|
|======================== | 49%
|
|========================= | 50%
|
|========================== | 51%
|
|========================== | 52%
|
|=========================== | 53%
|
|=========================== | 54%
|
|============================ | 55%
|
|============================ | 56%
|
|============================= | 57%
|
|============================= | 58%
|
|============================== | 59%
|
|============================== | 60%
|
|=============================== | 61%
|
|=============================== | 62%
|
|================================ | 63%
|
|================================ | 64%
|
|================================= | 65%
|
|================================= | 66%
|
|================================= | 67%
|
|================================== | 68%
|
|================================== | 69%
|
|=================================== | 70%
|
|=================================== | 71%
|
|==================================== | 72%
|
|==================================== | 73%
|
|===================================== | 74%
|
|===================================== | 75%
|
|====================================== | 76%
|
|====================================== | 77%
|
|======================================= | 78%
|
|======================================= | 79%
|
|======================================== | 80%
|
|======================================== | 81%
|
|========================================= | 82%
|
|========================================= | 83%
|
|========================================== | 83%
|
|========================================== | 84%
|
|=========================================== | 85%
|
|=========================================== | 86%
|
|============================================ | 87%
|
|============================================ | 88%
|
|============================================= | 89%
|
|============================================= | 90%
|
|============================================== | 91%
|
|============================================== | 92%
|
|=============================================== | 93%
|
|=============================================== | 94%
|
|================================================ | 95%
|
|================================================ | 96%
|
|================================================= | 97%
|
|================================================= | 98%
|
|==================================================| 99%
|
|==================================================| 100%
MAE_tydal$best <- ifelse(MAE_tydal$MAE == min(MAE_tydal$MAE),
"best", "not-best")For Geilo the calculations take longer, so I will not consider as big a range in power.
myPowers2 <- seq(0, 5, 1)
MAE_geilo <- data.frame(power = myPowers2, MAE = as.numeric(NA))
for (i in myPowers2) {
    temp <- krige.cv(Dybde ~ 1, depths_geilo, set = list(idp = i),
        nmax = nmax)
    MAE_geilo$MAE[MAE_geilo$power == i] <- mean(abs(temp$residual))
}

MAE_geilo$best <- ifelse(MAE_geilo$MAE == min(MAE_geilo$MAE),
    "best", "not-best")
saveRDS(MAE_geilo, "Data/cache/MAE_geilo_cashe.rds")
myPowers2 <- seq(0, 5, 1)
gg_MAE_tydal <- ggplot(MAE_tydal, aes(x = power, y = MAE,
    colour = best, shape = best)) + geom_point(size = 10) +
    theme_bw(base_size = 12) + scale_x_continuous(breaks = myPowers) +
    guides(colour = "none", shape = "none") + scale_color_manual(values = c("darkgreen",
    "grey")) + scale_shape_manual(values = c(18, 19)) +
    ggtitle("Tydal")

gg_MAE_geilo <- ggplot(MAE_geilo, aes(x = power, y = MAE,
    colour = best, shape = best)) + geom_point(size = 10) +
    theme_bw(base_size = 12) + scale_x_continuous(breaks = myPowers2) +
    guides(colour = "none", shape = "none") + scale_color_manual(values = c("darkgreen",
    "grey")) + scale_shape_manual(values = c(18, 19)) +
    ggtitle("Geilo")

ggpubr::ggarrange(gg_MAE_geilo, gg_MAE_tydal)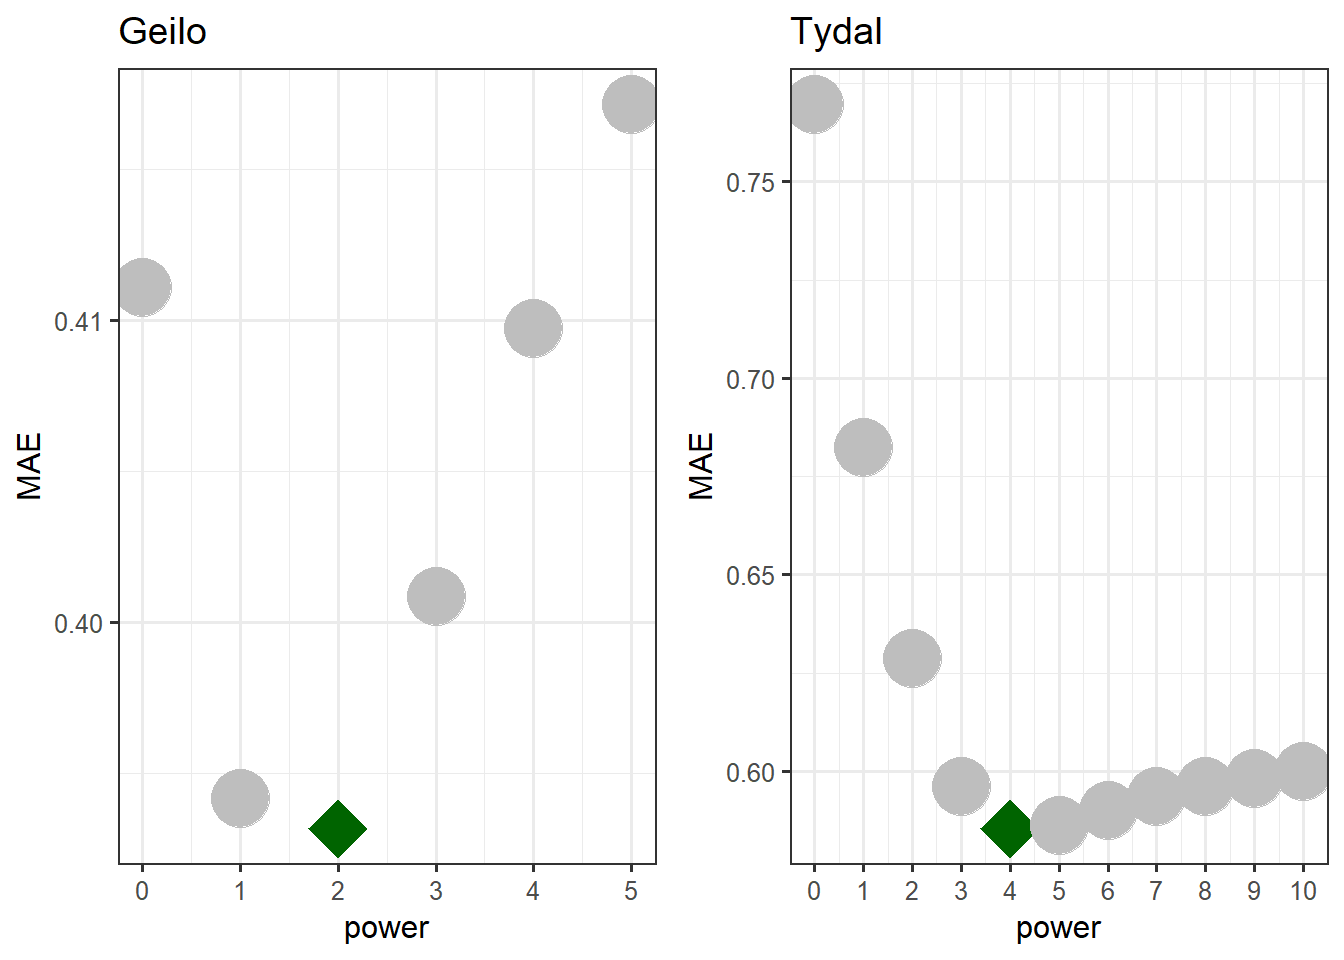
Figure 3.11: Mean absolute error based on leave-one-out cross validation. The optimal power setting is indicated by a green star symbol.
The mean absolute error is not negligible in any of the two cases. The interpretation is, if you leave out one of the peat depth measurements and predict the peat depth in that point (using just the remaining data points) the models are on average 40-60 cm wrong.
The best models have power = 2 for Geilo and 4 for Tydal. These models also look reasonable in terms of predicted peat volume and the spread of the raw residuals (Figs. 3.7 and 3.8). But the map for Geilo is quite spotted, and perhaps a higher power would be smart. I will therefore change it to 3. This is justified also because of the minimal impact in MAE and the predicted volume. For Geilo, we probably would get better results if we analysed each polygon separately.
Note: A power less than 2 is not recommended as we have seen above. With nmax set to 9, the optimum power for Geilo was actually 1. I therefore went back up in the script and increased nmax to 20.
3.6 Best models
Based on a criterion of lowest MAE (but above 2) we have identified the best IDW models for the two test sites:
tm_tydal <- tm_shape(IDW_tydal_4) + tm_raster(col = "var1.pred",
    palette = "-viridis", title = "Interpolated peat\ndepth (m)") +
    tm_shape(depths_tydal) + tm_symbols(shape = 4,
    col = "black", size = 0.5) + tm_compass(type = "8star",
    position = c("right", "bottom"), size = 2) + tm_scale_bar(position = c("left",
    "bottom"), width = 0.3) + tm_layout(inner.margins = c(0.15,
    0.05, 0, 0.05), legend.outside = T)

# tmap::tmap_save(tm_tydal,
# 'Output/plot_IDW_tydal_bestModel.tiff', width =
# 1600, height = 1600, units = 'px')
tm_tydal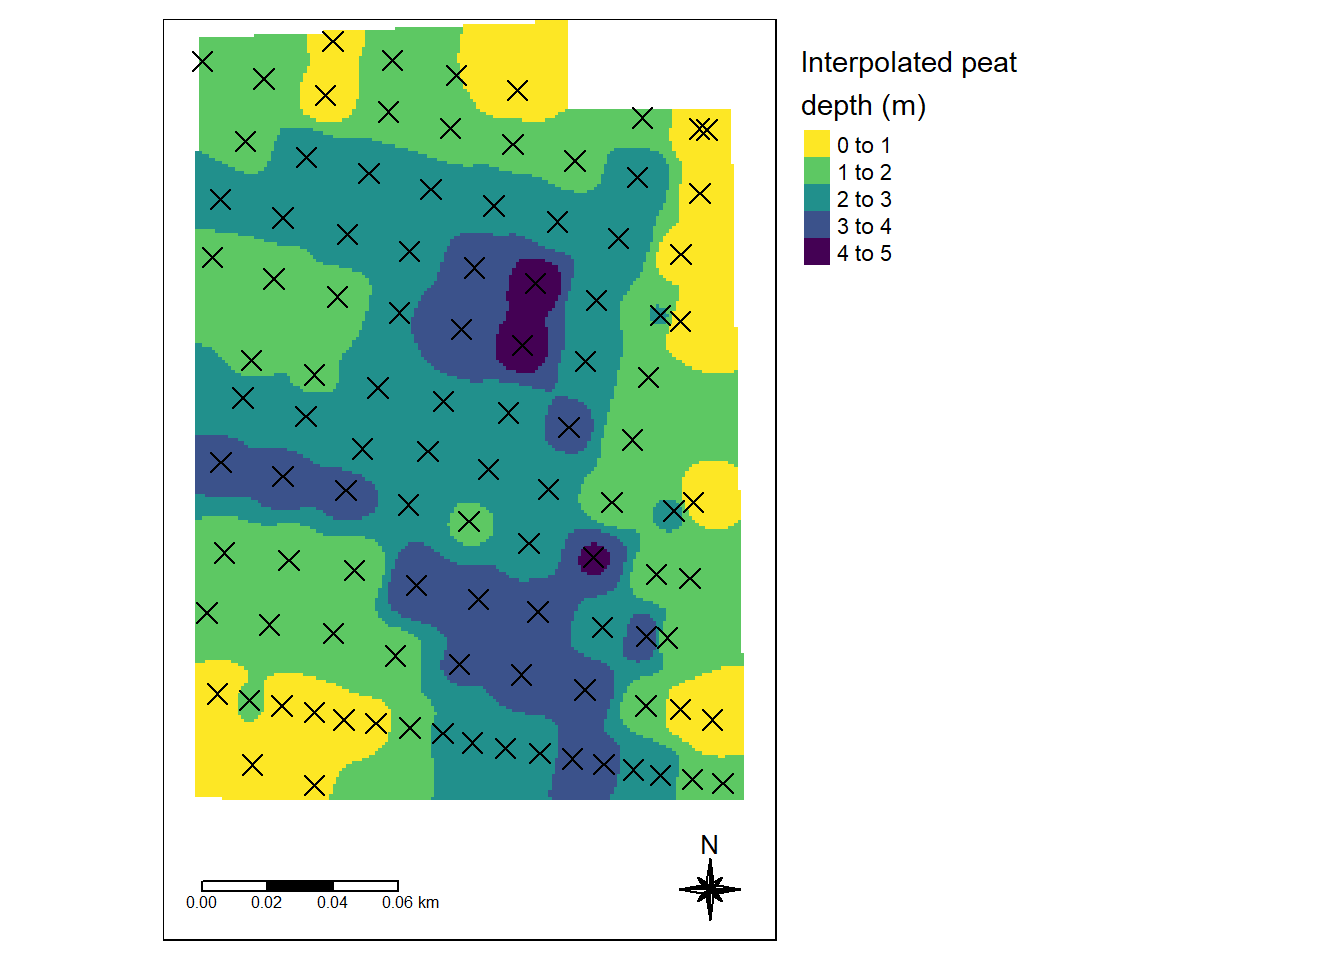
Figure 3.12: Best model for estimating the peat depth profile for the Tydal test site. Dots indicatore peat depth sampling points. MAE = 0.59 meters. Power = 4.
IDW_geilo_3 <- gstat::idw(formula = Dybde ~ 1, locations = depths_geilo,
    newdata = grid_Geilo_stars_crop, idp = 2, nmax = nmax)
tm_geilo <- tm_shape(IDW_geilo_3) + tm_raster(col = "var1.pred",
    palette = "-viridis", title = "Interpolated peat\ndepth (m)") +
    tm_compass(type = "8star", position = c("right",
        "bottom"), size = 2) + tm_scale_bar(position = c("right",
    "bottom"), width = 0.3)

# tmap::tmap_save(tm_geilo,
# 'Output/plot_IDW_geilo_bestModel.tiff', width =
# 1600, height = 1600, units = 'px')
tm_geilo
#> stars object downsampled to 1369 by 730 cells. See tm_shape manual (argument raster.downsample)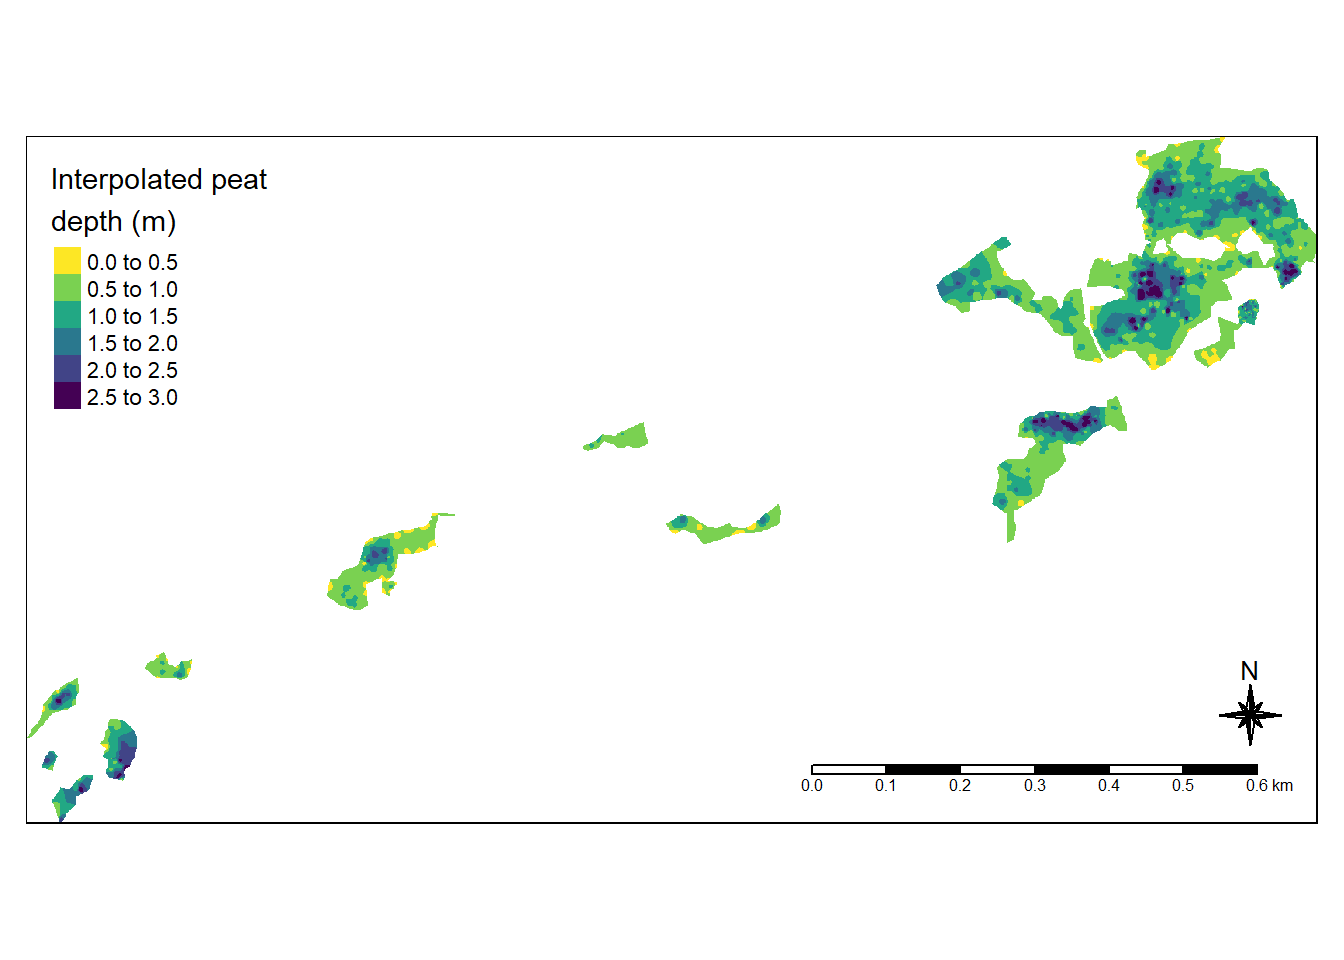
Figure 3.13: Best model for estimating the peat depth profile for the Geilo test site. Dots indicatore peat depth sampling points. MAE = 0.4 meters. Power = 3.
Tydal is 7.7336967^{4} m3 and Geilo is 1.0246996^{5} m3. We can get the residuals from LOOCV.
SE_tydal <- krige.cv(Dybde ~ 1, depths_tydal, set = list(idp = 4),
nmax = nmax)
#>
|
| | 0%
|
| | 1%
|
|= | 2%
|
|= | 3%
|
|== | 4%
|
|== | 5%
|
|=== | 6%
|
|=== | 7%
|
|==== | 8%
|
|==== | 9%
|
|===== | 10%
|
|===== | 11%
|
|====== | 12%
|
|====== | 13%
|
|======= | 14%
|
|======= | 15%
|
|======== | 16%
|
|======== | 17%
|
|========= | 17%
|
|========= | 18%
|
|========== | 19%
|
|========== | 20%
|
|=========== | 21%
|
|=========== | 22%
|
|============ | 23%
|
|============ | 24%
|
|============= | 25%
|
|============= | 26%
|
|============== | 27%
|
|============== | 28%
|
|=============== | 29%
|
|=============== | 30%
|
|================ | 31%
|
|================ | 32%
|
|================= | 33%
|
|================= | 34%
|
|================= | 35%
|
|================== | 36%
|
|================== | 37%
|
|=================== | 38%
|
|=================== | 39%
|
|==================== | 40%
|
|==================== | 41%
|
|===================== | 42%
|
|===================== | 43%
|
|====================== | 44%
|
|====================== | 45%
|
|======================= | 46%
|
|======================= | 47%
|
|======================== | 48%
|
|======================== | 49%
|
|========================= | 50%
|
|========================== | 51%
|
|========================== | 52%
|
|=========================== | 53%
|
|=========================== | 54%
|
|============================ | 55%
|
|============================ | 56%
|
|============================= | 57%
|
|============================= | 58%
|
|============================== | 59%
|
|============================== | 60%
|
|=============================== | 61%
|
|=============================== | 62%
|
|================================ | 63%
|
|================================ | 64%
|
|================================= | 65%
|
|================================= | 66%
|
|================================= | 67%
|
|================================== | 68%
|
|================================== | 69%
|
|=================================== | 70%
|
|=================================== | 71%
|
|==================================== | 72%
|
|==================================== | 73%
|
|===================================== | 74%
|
|===================================== | 75%
|
|====================================== | 76%
|
|====================================== | 77%
|
|======================================= | 78%
|
|======================================= | 79%
|
|======================================== | 80%
|
|======================================== | 81%
|
|========================================= | 82%
|
|========================================= | 83%
|
|========================================== | 83%
|
|========================================== | 84%
|
|=========================================== | 85%
|
|=========================================== | 86%
|
|============================================ | 87%
|
|============================================ | 88%
|
|============================================= | 89%
|
|============================================= | 90%
|
|============================================== | 91%
|
|============================================== | 92%
|
|=============================================== | 93%
|
|=============================================== | 94%
|
|================================================ | 95%
|
|================================================ | 96%
|
|================================================= | 97%
|
|================================================= | 98%
|
|==================================================| 99%
|
|==================================================| 100%
SE_geilo <- krige.cv(Dybde ~ 1, depths_geilo, set = list(idp = 3),
nmax = nmax)
#>
|
| | 0%
|
| | 1%
|
|= | 1%
|
|= | 2%
|
|= | 3%
|
|== | 3%
|
|== | 4%
|
|== | 5%
|
|=== | 5%
|
|=== | 6%
|
|=== | 7%
|
|==== | 7%
|
|==== | 8%
|
|==== | 9%
|
|===== | 9%
|
|===== | 10%
|
|===== | 11%
|
|====== | 11%
|
|====== | 12%
|
|====== | 13%
|
|======= | 13%
|
|======= | 14%
|
|======= | 15%
|
|======== | 15%
|
|======== | 16%
|
|======== | 17%
|
|========= | 17%
|
|========= | 18%
|
|========= | 19%
|
|========== | 19%
|
|========== | 20%
|
|========== | 21%
|
|=========== | 21%
|
|=========== | 22%
|
|=========== | 23%
|
|============ | 23%
|
|============ | 24%
|
|============ | 25%
|
|============= | 25%
|
|============= | 26%
|
|============= | 27%
|
|============== | 27%
|
|============== | 28%
|
|============== | 29%
|
|=============== | 29%
|
|=============== | 30%
|
|=============== | 31%
|
|================ | 31%
|
|================ | 32%
|
|================ | 33%
|
|================= | 33%
|
|================= | 34%
|
|================= | 35%
|
|================== | 35%
|
|================== | 36%
|
|================== | 37%
|
|=================== | 37%
|
|=================== | 38%
|
|=================== | 39%
|
|==================== | 39%
|
|==================== | 40%
|
|==================== | 41%
|
|===================== | 41%
|
|===================== | 42%
|
|===================== | 43%
|
|====================== | 43%
|
|====================== | 44%
|
|====================== | 45%
|
|======================= | 45%
|
|======================= | 46%
|
|======================= | 47%
|
|======================== | 47%
|
|======================== | 48%
|
|======================== | 49%
|
|========================= | 49%
|
|========================= | 50%
|
|========================= | 51%
|
|========================== | 51%
|
|========================== | 52%
|
|========================== | 53%
|
|=========================== | 53%
|
|=========================== | 54%
|
|=========================== | 55%
|
|============================ | 55%
|
|============================ | 56%
|
|============================ | 57%
|
|============================= | 57%
|
|============================= | 58%
|
|============================= | 59%
|
|============================== | 59%
|
|============================== | 60%
|
|============================== | 61%
|
|=============================== | 61%
|
|=============================== | 62%
|
|=============================== | 63%
|
|================================ | 63%
|
|================================ | 64%
|
|================================ | 65%
|
|================================= | 65%
|
|================================= | 66%
|
|================================= | 67%
|
|================================== | 67%
|
|================================== | 68%
|
|================================== | 69%
|
|=================================== | 69%
|
|=================================== | 70%
|
|=================================== | 71%
|
|==================================== | 71%
|
|==================================== | 72%
|
|==================================== | 73%
|
|===================================== | 73%
|
|===================================== | 74%
|
|===================================== | 75%
|
|====================================== | 75%
|
|====================================== | 76%
|
|====================================== | 77%
|
|======================================= | 77%
|
|======================================= | 78%
|
|======================================= | 79%
|
|======================================== | 79%
|
|======================================== | 80%
|
|======================================== | 81%
|
|========================================= | 81%
|
|========================================= | 82%
|
|========================================= | 83%
|
|========================================== | 83%
|
|========================================== | 84%
|
|========================================== | 85%
|
|=========================================== | 85%
|
|=========================================== | 86%
|
|=========================================== | 87%
|
|============================================ | 87%
|
|============================================ | 88%
|
|============================================ | 89%
|
|============================================= | 89%
|
|============================================= | 90%
|
|============================================= | 91%
|
|============================================== | 91%
|
|============================================== | 92%
|
|============================================== | 93%
|
|=============================================== | 93%
|
|=============================================== | 94%
|
|=============================================== | 95%
|
|================================================ | 95%
|
|================================================ | 96%
|
|================================================ | 97%
|
|================================================= | 97%
|
|================================================= | 98%
|
|================================================= | 99%
|
|==================================================| 99%
|
|==================================================| 100%
ggplot(SE_tydal, aes(x = residual)) + geom_histogram()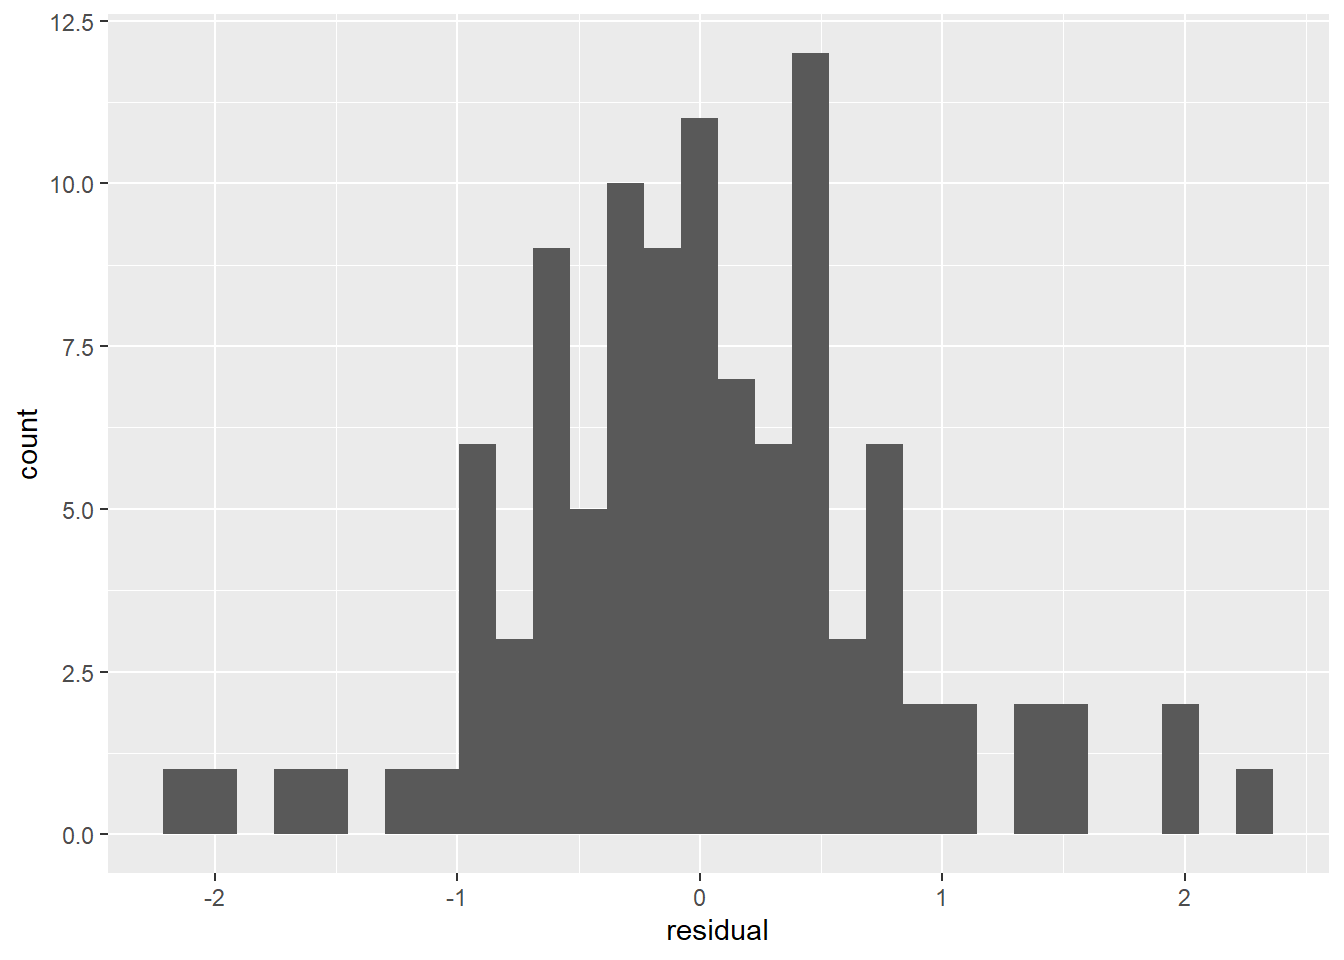
Figure 3.14: Resuduals from LOOCV. Test site: Tydal
For any point inside the prediction area, we assume an error equal to the mean residual from LOOCV. For Tydal, this is 0.59 meters. There is no clear way how to predict confidence intervals for IDW. The residuals, and the MAE, represents uncertainty for each grid cell value, and not uncertainty in the sum of all these grid cells. Since the mean of the residuals (not the absolute mean, but the normal mean) is quite close to 0, the uncertainty for each cell cancels out.
We can calculate the peat volume based on the best model
volume <- data.frame(site = c("Tydal", "Geilo"), volume = c(sum(IDW_tydal_4$var1.pred,
    na.rm = T), sum(IDW_geilo_3$var1.pred, na.rm = T)))
library(ggtext)  # write superscript as markdown
ggplot(volume, aes(x = site, y = volume)) + geom_bar(stat = "identity",
    colour = "black", fill = "grey") + theme_bw(base_size = 12) +
    theme(axis.title.y = element_markdown()) + ylab("Volume m^(3)")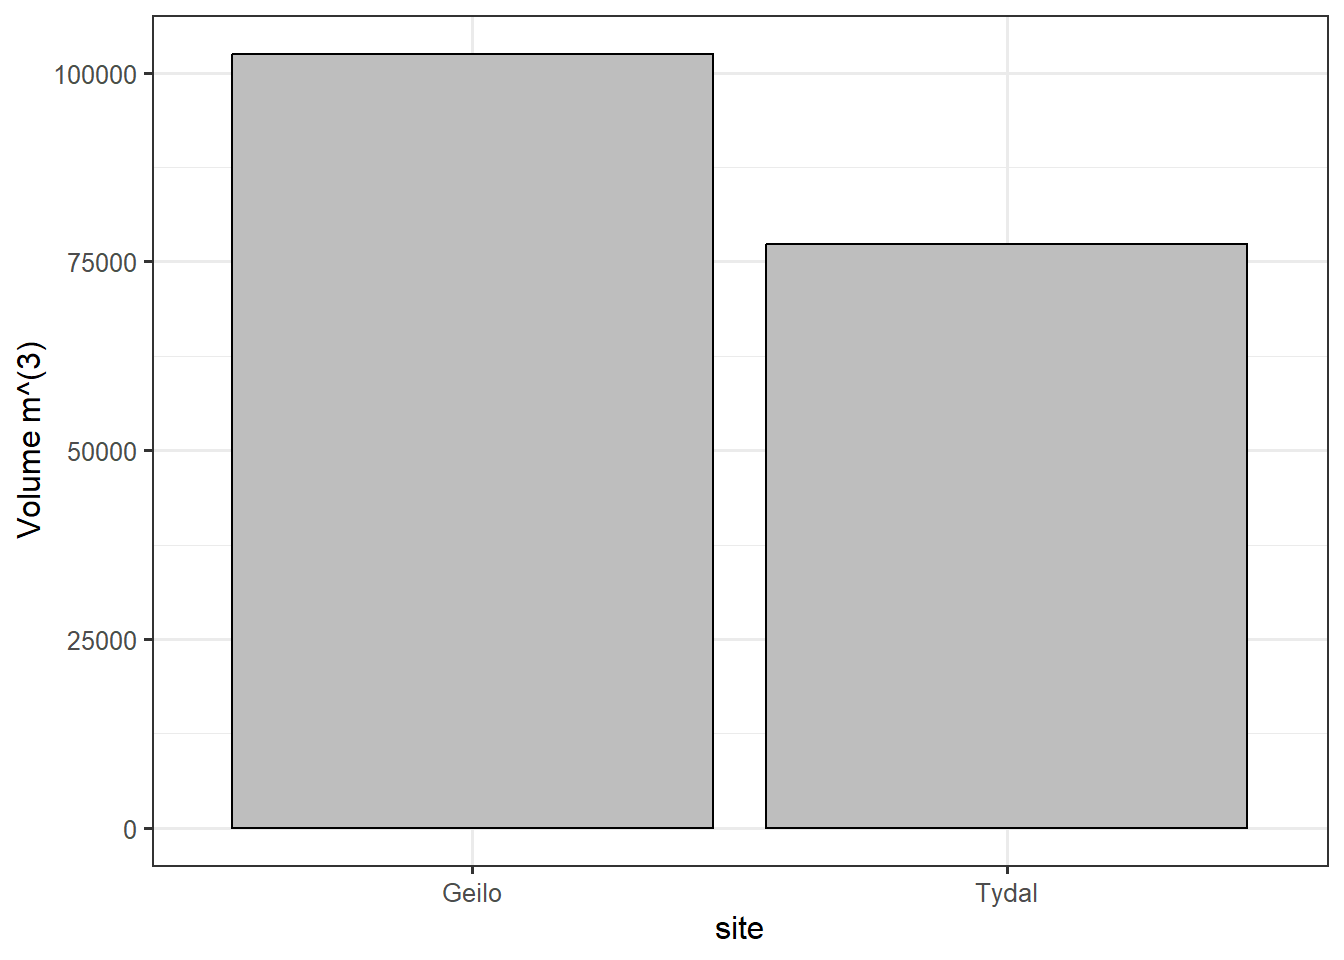
Figure 3.15: Peat volume estimated from IDW.
The rough volume (no iDW) Tydal and Geilo
SHP_tydal$myArea <- sf::st_area(SHP_tydal)
mean(depths_tydal$Dybde) * sum(SHP_tydal$myArea)
#> 76994.27 [m^2]
SHP_geilo$myArea <- sf::st_area(SHP_geilo)
mean(depths_geilo$Dybde) * sum(SHP_geilo$myArea)
#> 98690.12 [m^2]
Next I want to try and estimate how many depth measurements I need to get a stable result, both on therms of peat volume and of visual appearance. Then I will also see if the same choice of the power parameter is still the best after removing some data points.